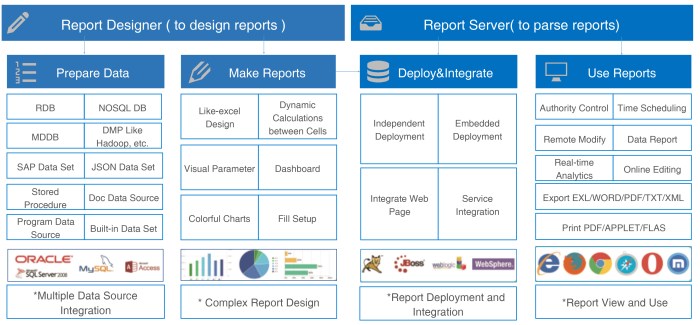
BI report generation is essential for informed decision-making, encompassing crucial elements, tool comparisons, and visualization techniques that drive business success. Dive into the world of BI reporting to unlock valuable insights and strategic advantages.
Overview of BI report generation

BI reports play a crucial role in the decision-making processes of organizations by providing valuable insights derived from data analysis. These reports help businesses make informed decisions based on trends, patterns, and key performance indicators.
Key Elements of Comprehensive BI Reports
- Clear and concise data visualization: Visual representations such as charts, graphs, and dashboards make complex data easier to understand at a glance.
- Data accuracy and reliability: Ensuring that the data used in BI reports is accurate and up-to-date is essential for informed decision-making.
- Customizable and interactive features: BI reports should allow users to customize the data they view and interact with the report to explore insights further.
- Integration of multiple data sources: Comprehensive BI reports often combine data from various sources to provide a holistic view of the business.
Examples of Industries Relying Heavily on BI Report Generation
- Retail: Retail companies use BI reports to analyze sales trends, customer behavior, and inventory management to optimize operations and improve profitability.
- Finance: Financial institutions rely on BI reports to monitor market trends, assess risk, and make strategic investment decisions based on data-driven insights.
- Healthcare: Healthcare organizations utilize BI reports to improve patient care, optimize resource allocation, and enhance operational efficiency through data analysis.
Tools and software for BI report generation

When it comes to Business Intelligence (BI) report generation, there are several popular tools and software available in the market that cater to different business needs. These tools offer various features and capabilities to help organizations analyze data, create insightful reports, and make informed decisions. Let’s compare and contrast some of the leading BI tools like Power BI, Tableau, and Qlik, and discuss how to select the right tool based on specific business requirements.
Power BI
Power BI is a powerful business analytics tool by Microsoft that allows users to visualize and share insights from their data. Some key features of Power BI include:
– Seamless integration with other Microsoft products like Excel, Azure, and Dynamics 365.
– User-friendly interface with drag-and-drop functionality for data visualization.
– Robust data modeling capabilities for creating relationships between different data sources.
– AI-powered analytics for generating automated insights and predictions.
– Ability to publish reports securely and share them with stakeholders.
Tableau
Tableau is a leading data visualization tool that helps organizations see and understand their data. Here are some notable features of Tableau:
– Intuitive drag-and-drop interface for creating interactive dashboards and reports.
– Support for a wide range of data sources, including spreadsheets, databases, and cloud services.
– Advanced analytics capabilities for forecasting, trend analysis, and statistical modeling.
– Robust sharing and collaboration options for distributing insights across the organization.
– Scalable architecture that can handle large datasets and complex queries.
Qlik
Qlik is a data analytics platform that enables users to explore and visualize data for better decision-making. Some key features of Qlik include:
– Associative data model that allows users to explore data freely without predefined paths.
– Interactive storytelling for creating compelling narratives with data.
– Powerful data integration capabilities for combining multiple data sources.
– Advanced data visualization options for uncovering hidden insights.
– Collaboration features for sharing insights and collaborating with team members.
Overall, the choice of BI tool depends on the specific requirements of the business, such as data sources, analytical needs, budget, and user expertise. Organizations should evaluate the features and capabilities of each tool against their unique needs to select the right BI software that will help them derive maximum value from their data.
Data collection and preparation for BI reports: BI Report Generation
Data collection and preparation are crucial steps in the process of generating Business Intelligence (BI) reports. These steps involve extracting data from various sources, cleaning and transforming it to ensure accuracy, and ultimately, making it ready for analysis and reporting.
Data Extraction Process
- Identifying data sources: The first step involves identifying the sources from which data needs to be extracted, such as databases, CRM systems, spreadsheets, etc.
- Extracting data: Once the sources are identified, data extraction tools are used to retrieve the necessary data in a structured format for analysis.
- Combining data: In some cases, data from multiple sources may need to be combined to create a comprehensive dataset for analysis.
Significance of Data Cleaning and Transformation
Data cleaning and transformation are essential to ensure the accuracy and reliability of BI reports. Here are some reasons why these steps are crucial:
- Eliminating errors: Data cleaning helps in identifying and correcting errors, duplicates, and inconsistencies in the dataset.
- Standardizing data: Transformation involves standardizing data formats and values to ensure uniformity for analysis.
- Enhancing data quality: By cleaning and transforming data, the overall quality of the dataset is improved, leading to more reliable insights.
Common Challenges in Data Collection and Preparation, BI report generation
- Data inconsistencies: Different sources may have varying data formats or missing values, making it challenging to combine and analyze the data.
- Volume of data: Dealing with a large volume of data can be overwhelming and may require efficient tools and techniques for processing.
- Data security concerns: Ensuring data privacy and security while collecting and preparing data is a significant challenge for organizations.
Visualization techniques in BI reporting

Visualizations play a crucial role in Business Intelligence (BI) reporting by helping users understand complex data through graphical representations. By choosing the right visualization methods, BI reports can effectively convey insights and trends to stakeholders. Let’s explore different visualization techniques and best practices for creating interactive and engaging visualizations.
Types of Visualization Methods
When it comes to BI reporting, various visualization methods can be utilized based on the type of data being analyzed. Some common types include:
- Bar Charts: Ideal for comparing data across categories.
- Line Charts: Useful for showing trends over time.
- Pie Charts: Effective for displaying proportions or percentages.
- Heatmaps: Great for visualizing patterns in large datasets.
- Scatter Plots: Helpful for identifying relationships between variables.
Best Practices for Interactive Visualizations
Creating interactive visualizations can enhance user engagement and allow for deeper exploration of data. Some best practices include:
- Include filters and drill-down options for users to interact with the data.
- Utilize tooltips to provide additional information when users hover over data points.
- Incorporate animations to make transitions between data points more engaging.
- Ensure responsiveness across different devices for a seamless user experience.
Choosing the Right Chart Types
Selecting the appropriate chart types is crucial for effectively communicating insights. Consider the following tips when choosing chart types:
- Understand the purpose of the data visualization and the message you want to convey.
- Take into account the type of data (e.g., categorical, numerical) and the relationships you want to highlight.
- Avoid cluttering the visualizations with unnecessary elements that may distract from the main insights.
- Experiment with different chart types to see which one best represents the data in a clear and concise manner.
In conclusion, mastering the art of BI report generation empowers organizations to harness data effectively, make informed decisions, and stay ahead in today’s competitive landscape. Explore the possibilities that BI reporting offers and revolutionize the way you analyze and interpret data.
When it comes to BI software for enterprises , businesses need a powerful tool to analyze data and make informed decisions. These software solutions offer advanced features to help organizations gain valuable insights and stay ahead of the competition.
For companies looking to stay competitive in today’s fast-paced business environment, real-time business intelligence is essential. With real-time data analytics, organizations can quickly adapt to market changes and make timely decisions to drive growth and profitability.
Efficiency is key in any business operation, which is why BI process optimization is crucial. By streamlining processes and improving data accuracy, companies can enhance productivity and maximize their ROI from BI investments.


