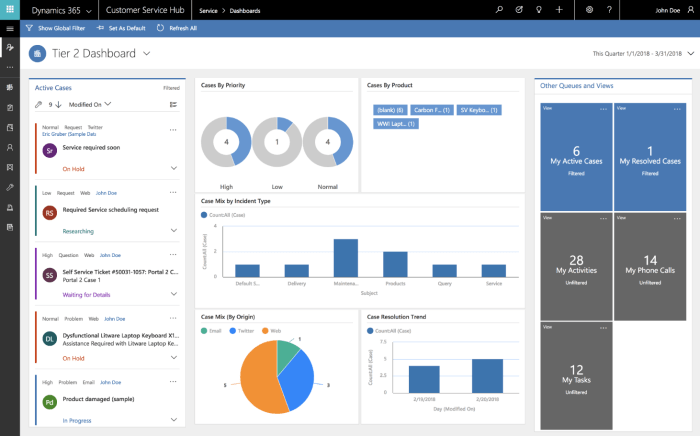
Interactive dashboards take center stage in the realm of data visualization and analysis, offering a dynamic and engaging way to present and explore data. Dive into the world of interactive dashboards where information comes to life with a click.
Explore the key design elements, interactive features, and tools that empower users to interact with data in a meaningful way, revolutionizing the data analysis process.
Introduction to Interactive Dashboards

Interactive dashboards are powerful tools in data visualization that allow users to manipulate and interact with data dynamically. These dashboards are designed to provide a user-friendly interface for exploring data, analyzing trends, and gaining insights quickly and efficiently.
Using interactive dashboards for data analysis offers numerous benefits. One major advantage is the ability to drill down into specific data points, filter information based on various criteria, and customize the display of data in real-time. This level of interactivity not only enhances the user experience but also enables users to uncover hidden patterns and make data-driven decisions effectively.
Various industries leverage interactive dashboards to streamline operations, improve decision-making processes, and communicate complex data effectively. For instance, in the financial sector, interactive dashboards are used to monitor market trends, track investment performance, and conduct risk analysis. In healthcare, these dashboards help healthcare providers visualize patient data, optimize treatment plans, and enhance patient care outcomes. Similarly, in marketing and sales, interactive dashboards are utilized to track campaign performance, analyze customer behavior, and identify growth opportunities.
Examples of Industries Using Interactive Dashboards
- Financial Services: Monitoring market trends, analyzing investment performance, conducting risk analysis.
- Healthcare: Visualizing patient data, optimizing treatment plans, enhancing patient care outcomes.
- Marketing and Sales: Tracking campaign performance, analyzing customer behavior, identifying growth opportunities.
Design Elements of Interactive Dashboards
Interactive dashboards rely on key design elements to effectively present data and engage users. These elements include widgets, filters, and drill-down capabilities, along with data visualization techniques like charts, graphs, and maps.
Widgets
Widgets are components that display specific data points or visualizations on the dashboard. They can include tables, charts, gauges, and more. Widgets allow users to quickly access and interpret data without navigating through multiple pages or reports.
Filters, Interactive dashboards
Filters enable users to customize the data displayed on the dashboard by selecting specific criteria or parameters. This interactive feature enhances data exploration and allows users to focus on the information that is most relevant to their needs.
Drill-down Capabilities
Drill-down capabilities allow users to explore data at different levels of detail. By clicking on specific data points or categories, users can uncover deeper insights and trends within the dataset. This feature enhances data analysis and supports informed decision-making.
Data Visualization Techniques
Effective data visualization techniques such as charts, graphs, and maps are essential in interactive dashboards. Visual representations help users quickly grasp complex information, identify patterns, and make data-driven decisions. Utilizing a variety of visualization types can enhance the overall user experience.
Tips for Creating Engaging and User-Friendly Dashboard Layouts
– Keep the layout clean and organized to avoid overwhelming users with information.
– Use consistent color schemes and fonts to maintain visual coherence.
– Provide clear labels and tooltips to explain data points and interactive features.
– Incorporate interactive elements such as hover effects and clickable components to enhance user engagement.
– Test the dashboard with real users to gather feedback and make improvements based on usability testing results.
Interactive Features and Functionality

Interactive dashboards offer a range of features and functionalities that allow users to engage with data in a dynamic and intuitive way. From hover-over effects to clickable elements and real-time data updates, these interactive elements enhance the user experience and facilitate data exploration and analysis.
Hover-over Effects
Hover-over effects provide additional information or context when users place their cursor over specific data points or visual elements on the dashboard. This feature allows users to access detailed insights without cluttering the dashboard interface.
Clickable Elements
Clickable elements enable users to interact with the dashboard by clicking on specific data points, filters, or buttons. This functionality allows users to drill down into details, explore related data, or navigate to different views within the dashboard, enhancing the overall interactivity.
Real-time Data Updates
Real-time data updates ensure that the information displayed on the dashboard is always current and reflective of the latest data inputs. This feature is particularly useful for monitoring live data streams, tracking key metrics, or making timely decisions based on up-to-date information.
Filtering and Sorting
Filtering and sorting functionalities empower users to customize their data views by selecting specific criteria, such as time periods, regions, or categories. These interactive features enable users to focus on relevant data subsets, identify trends, and gain deeper insights into the dataset.
Dynamic Content Generation
Dynamic content generation allows users to create custom views, reports, or visualizations based on their unique requirements. By dynamically updating the content based on user inputs or selections, this feature enables users to tailor the dashboard to their specific needs and preferences.
Role of User Interactivity
User interactivity plays a crucial role in enhancing data exploration and analysis by providing users with the flexibility to interact with data in a meaningful way. By enabling users to engage with data visually, interactively, and intuitively, interactive dashboards empower users to derive actionable insights, identify patterns, and make informed decisions.
Tools and Platforms for Building Interactive Dashboards

When it comes to building interactive dashboards, there are several tools and platforms available in the market that offer a variety of features and capabilities. Choosing the right tool for your project requirements is crucial to ensure the success of your dashboard design.
Popular Tools and Software
- Tableau: Tableau is a leading data visualization tool known for its user-friendly interface and powerful analytics capabilities. It offers a wide range of visualization options and interactive features.
- Power BI: Developed by Microsoft, Power BI is another popular choice for creating interactive dashboards. It seamlessly integrates with other Microsoft products and offers advanced data modeling capabilities.
- Google Data Studio: Google Data Studio is a free tool that allows users to create customizable and interactive dashboards using data from various sources such as Google Analytics, Google Sheets, and more.
Feature Comparison
| Tool | Features | Capabilities |
|---|---|---|
| Tableau | Wide range of visualization options, User-friendly interface | Powerful analytics capabilities, Advanced interactive features |
| Power BI | Integration with Microsoft products, Advanced data modeling | Real-time analytics, AI-powered insights |
| Google Data Studio | Free tool, Customizable dashboards | Integration with Google services, Collaboration features |
Choosing the Right Tool
- Consider the data sources: Some tools are better suited for specific data sources, so choose a tool that can easily connect to your data.
- Assess the learning curve: Evaluate the ease of use and learning curve of each tool, especially if you have a team working on the dashboard.
- Cost and scalability: Take into account the cost of the tool and its scalability to meet your project requirements in the long run.
In conclusion, interactive dashboards revolutionize the way data is visualized and analyzed, providing a powerful tool for businesses and industries to make informed decisions based on data-driven insights. Embrace the interactive dashboard revolution and unlock the full potential of your data.
When it comes to handling massive amounts of data, companies rely on Big Data BI tools. These tools help in analyzing and interpreting data to make informed business decisions. Additionally, BI analytics play a crucial role in extracting valuable insights from data, leading to improved performance and productivity. To present data in a visually appealing way, businesses turn to Data visualization software , which simplifies complex information and enhances understanding for better decision-making.
When it comes to analyzing large amounts of data, businesses rely on Big Data BI tools to make sense of it all. These tools help companies extract valuable insights and identify trends that can drive decision making. Additionally, BI analytics play a crucial role in transforming raw data into actionable information. To further enhance this process, businesses utilize Data visualization software to create interactive and visually appealing representations of their data.


