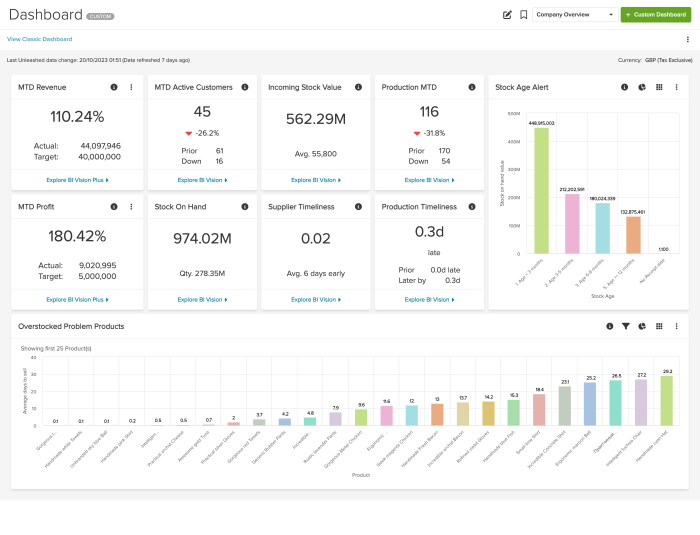
Custom BI dashboards revolutionize data visualization by offering tailored insights and interactive features for enhanced user experience. From design principles to seamless data integration, explore the key elements that make these dashboards indispensable tools for informed decision-making.
Introduction to Custom BI Dashboards
Custom BI dashboards are personalized data visualization tools that allow businesses to analyze and present their data in a way that is tailored to their specific needs and goals. These dashboards are designed to provide insights and key performance indicators (KPIs) that are relevant to a particular organization, making it easier for decision-makers to understand and act upon the data presented.
Importance of Custom BI Dashboards
Custom BI dashboards play a crucial role in data visualization by enabling organizations to focus on the most relevant data points and metrics that align with their business objectives. Unlike standard BI dashboards, which may contain generic metrics that are not always applicable to every organization, custom BI dashboards allow for a more targeted and meaningful analysis of data. This level of customization helps businesses make informed decisions based on real-time data, leading to improved performance and competitiveness in the market.
Differences from Standard BI Dashboards
– Customization: Custom BI dashboards are tailored to the specific needs and requirements of an organization, whereas standard BI dashboards offer a one-size-fits-all approach.
– Flexibility: Custom BI dashboards allow for greater flexibility in terms of data sources, visualization options, and interactive features compared to standard BI dashboards.
– User-Centric Design: Custom BI dashboards are designed with the end user in mind, ensuring that the data presented is easily digestible and actionable, while standard BI dashboards may not always prioritize user experience.
Designing Custom BI Dashboards
When it comes to designing custom Business Intelligence (BI) dashboards, there are several best practices to keep in mind to ensure they are visually appealing and effective in conveying data insights to users.
Utilize a Clean and Intuitive Layout
One of the key aspects of designing custom BI dashboards is to maintain a clean and intuitive layout. Avoid cluttering the dashboard with unnecessary information or visuals that do not add value. Organize the data in a logical manner, making it easy for users to navigate and understand the insights presented.
When it comes to developing a successful BI strategy , businesses need to focus on gathering relevant data, analyzing it effectively, and using the insights to make informed decisions. A well-defined BI strategy can help organizations stay ahead of the competition and drive growth.
Tailor Dashboards to Specific User Needs
Custom BI dashboards should be tailored to specific user needs and requirements. Take the time to understand the audience who will be using the dashboard and what key metrics or insights are most important to them. By customizing the dashboard to meet these specific needs, you can enhance user engagement and ensure the information is relevant and actionable.
Implementing decision support systems can streamline the decision-making process by providing real-time data and analysis. These systems enable businesses to make data-driven decisions quickly and accurately, leading to improved operational efficiency and performance.
Use Color Schemes Wisely
Color schemes play a crucial role in designing effective custom BI dashboards. Choose a color palette that is visually appealing but also aids in highlighting important data points or trends. Use colors strategically to draw attention to key insights and ensure that the dashboard is easy to read and interpret.
Data Integration in Custom BI Dashboards

Data integration in custom BI dashboards refers to the process of combining and harmonizing data from multiple sources to provide a unified view for analysis and decision-making. This integration is crucial for ensuring that the dashboard delivers accurate and comprehensive insights to users.
Challenges and Solutions in Data Integration
Integrating diverse data sources can pose several challenges, such as inconsistencies in data formats, varying levels of data quality, and the need to handle large volumes of data. However, there are solutions to address these challenges and ensure seamless data integration:
- Standardization: Establishing data standards and formats across different sources can help ensure consistency and compatibility during integration.
- Data Cleansing: Implementing data cleansing techniques to remove errors, duplicates, and inconsistencies can improve data quality before integration.
- ETL Tools: Using Extract, Transform, Load (ETL) tools can automate the process of extracting data from various sources, transforming it into a consistent format, and loading it into the BI dashboard.
- API Integration: Leveraging Application Programming Interfaces (APIs) can facilitate direct connections between the dashboard and external data sources, enabling real-time data updates.
Tools and Techniques for Data Integration
Several tools and techniques are available to support seamless data integration in custom BI dashboards:
| Tool/Technique | Description |
|---|---|
| Apache Nifi | An open-source data integration platform that enables visual data flow design and automation of data movement. |
| Talend | A data integration tool with a graphical interface for designing data pipelines and workflows for BI applications. |
| Data Virtualization | A technique that allows data to be accessed and integrated in real-time without physically moving or copying it. |
Interactive Features in Custom BI Dashboards

Interactive features play a crucial role in enhancing the user experience and increasing the effectiveness of custom BI dashboards. These elements, such as filters, drill-downs, and tooltips, provide users with the ability to interact with data in a more dynamic and personalized way.
Importance of Interactive Elements
Interactive elements like filters allow users to customize the data they want to see, providing a more tailored and relevant view of the information. Drill-downs enable users to delve deeper into specific data points, uncovering insights that may not be immediately apparent. Tooltips offer additional context and information when hovering over data points, enhancing the overall understanding of the data.
- Filters: Empower users to focus on specific data subsets based on their preferences or requirements.
- Drill-downs: Enable users to explore data hierarchies or detailed information by clicking on specific data points.
- Tooltips: Provide supplementary information or context when hovering over data points, enhancing data comprehension.
Implementing Interactive Features
To implement interactive features effectively, it is essential to understand the needs and preferences of the end-users. Customizing filters, drill-down paths, and tooltips to align with user goals can significantly improve the usability and relevance of the dashboard.
- Customization: Tailor interactive elements to match the user’s workflow and data exploration preferences.
- User Testing: Validate interactive features through user testing to ensure they enhance, rather than hinder, the user experience.
- Feedback Loop: Gather feedback on interactive features to continuously improve and optimize the dashboard for usability.
Impact of Real-Time Data Updates, Custom BI dashboards
Real-time data updates can significantly impact the effectiveness of custom BI dashboards by providing users with the most current information available. This ensures that decisions are based on up-to-date data, leading to more informed and timely actions.
Real-time data updates enhance decision-making by providing the most current information for analysis and insights.
- Timeliness: Real-time data updates allow users to make decisions based on the latest information available, leading to more accurate insights.
- Actionability: Immediate data updates enable users to act swiftly on emerging trends or issues, improving responsiveness.
- Competitive Advantage: Access to real-time data can give organizations a competitive edge by enabling quick and informed decision-making.
In conclusion, Custom BI dashboards empower businesses to unlock the full potential of their data, driving strategic growth and competitive advantage. With customizable designs and real-time updates, these dashboards are a game-changer in the world of business intelligence.
Utilizing BI solutions for business can help organizations gain valuable insights into their operations, customers, and market trends. By leveraging BI tools and technologies, businesses can make more informed decisions, optimize processes, and drive growth.


