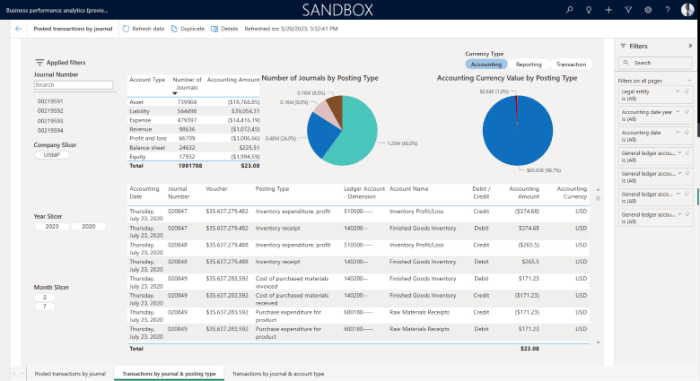
Business performance analytics is a crucial aspect of modern organizations, driving success through data-driven insights and strategic decision-making. This comprehensive guide delves into the core concepts and practical applications of business performance analytics, shedding light on its significance and impact in today’s competitive landscape.
From defining key performance indicators to exploring advanced tools and technologies, this guide equips you with the knowledge and resources needed to leverage analytics effectively for optimizing business performance.
Introduction to Business Performance Analytics
Business performance analytics involves the use of data and statistical methods to analyze and assess the performance of a business. It helps organizations to track their progress, identify areas for improvement, and make informed decisions based on data-driven insights.
Importance of Utilizing Business Performance Analytics
Utilizing business performance analytics is crucial for organizations to stay competitive in today’s fast-paced business environment. By leveraging data analysis, companies can gain valuable insights into their operations, customer behavior, and market trends. This enables them to make strategic decisions, optimize processes, and drive growth.
Examples of Key Performance Indicators (KPIs)
- Sales Revenue: This KPI measures the total amount of revenue generated from sales.
- Customer Acquisition Cost: This KPI calculates the cost incurred to acquire a new customer.
- Profit Margin: This KPI evaluates the profitability of a business by comparing revenue to expenses.
- Customer Lifetime Value: This KPI estimates the total value a customer brings to a business over their lifetime.
Tools and Technologies for Business Performance Analytics

Business performance analytics rely on a variety of tools and technologies to collect, analyze, and interpret data. These tools play a crucial role in helping organizations make informed decisions and optimize their performance. Let’s explore some popular tools and software used for business performance analytics.
Popular Tools and Software
- Google Analytics: A widely used tool for website analytics, providing valuable insights into user behavior, traffic sources, and conversions.
- Tableau: Known for its powerful data visualization capabilities, Tableau helps businesses create interactive dashboards for easy data analysis.
- Microsoft Power BI: Another popular choice for data visualization and business intelligence, offering a user-friendly interface and robust analytics features.
- Salesforce Analytics Cloud: Specifically designed for sales and marketing analytics, Salesforce Analytics Cloud helps organizations track performance metrics and customer insights.
- SAP BusinessObjects: Offering a suite of tools for reporting, querying, and data analysis, SAP BusinessObjects is a comprehensive solution for business intelligence.
Comparison of Analytics Software
- Google Analytics is ideal for web analytics but may lack the advanced features required for complex data analysis compared to tools like Tableau and Power BI.
- Tableau and Power BI offer more advanced data visualization capabilities, making them suitable for in-depth business intelligence analysis.
- Salesforce Analytics Cloud is tailored for sales and marketing teams, providing specific insights into customer interactions and sales performance.
- SAP BusinessObjects is a comprehensive solution that covers a wide range of analytics needs, including reporting, ad-hoc queries, and predictive analytics.
Role of Artificial Intelligence and Machine Learning
Artificial intelligence (AI) and machine learning (ML) are revolutionizing business performance analytics by automating data analysis, identifying patterns, and predicting outcomes. AI-powered tools can process large datasets quickly, uncover hidden insights, and provide valuable recommendations for improving business performance. By leveraging AI and ML technologies, organizations can gain a competitive edge and drive strategic decision-making based on data-driven insights.
Data Collection and Analysis for Business Performance Analytics

Data collection and analysis are crucial components of business performance analytics, enabling organizations to make informed decisions based on data-driven insights. In this section, we will delve into the process of collecting data, methods for cleaning and preparing data, and different data visualization techniques used in presenting analytics results.
Process of Collecting Data for Business Performance Analytics
Data collection for business performance analytics involves gathering relevant information from various sources, such as internal databases, third-party data providers, customer interactions, and market research. Organizations can use tools like customer relationship management (CRM) systems, enterprise resource planning (ERP) software, and web analytics platforms to collect data. It is essential to ensure data accuracy, completeness, and relevance during the collection process to obtain meaningful insights.
Methods for Cleaning and Preparing Data for Analysis
Before conducting analysis, it is essential to clean and prepare the data to ensure accuracy and consistency. Common methods for cleaning data include removing duplicates, handling missing values, standardizing formats, and resolving inconsistencies. Preparing data involves transforming raw data into a structured format suitable for analysis, which may include data normalization, aggregation, and feature engineering. Data cleaning and preparation are critical steps to ensure the quality and reliability of analytics results.
Data Visualization Techniques for Presenting Analytics Results
Data visualization plays a vital role in presenting analytics results effectively to stakeholders. Different techniques, such as charts, graphs, dashboards, and heat maps, can be used to visually represent data insights. Visualization helps in identifying trends, patterns, and outliers in the data, making it easier for decision-makers to interpret and act on the information. Interactive visualizations allow users to explore data dynamically and gain deeper insights into business performance metrics.
Implementing Business Performance Analytics in Organizations

Implementing business performance analytics in organizations involves a strategic approach to integrating data-driven decision-making processes to enhance overall performance and efficiency.
Steps for Integrating Business Performance Analytics
- Define Key Performance Indicators (KPIs) that align with organizational goals and objectives.
- Identify the data sources needed to measure KPIs accurately and consistently.
- Invest in the right analytics tools and technologies to collect, analyze, and visualize data effectively.
- Build a data-driven culture within the organization by training employees on how to interpret and use analytics insights.
- Regularly monitor and review performance metrics to identify areas for improvement and make data-driven decisions.
Best Practices for Monitoring and Evaluating Performance Using Analytics, Business performance analytics
- Establish a data governance framework to ensure data quality, security, and compliance.
- Utilize real-time analytics to track performance metrics and make timely adjustments as needed.
- Implement data visualization techniques to present complex data in a clear and actionable format.
- Create customized dashboards and reports to provide relevant insights to different stakeholders within the organization.
- Regularly communicate performance analytics findings with key decision-makers to drive strategic initiatives and improvements.
Challenges Organizations May Face When Implementing Business Performance Analytics
- Lack of data quality and consistency across different systems and departments.
- Resistance to change and adoption of new data-driven processes and technologies.
- Inadequate data literacy and skills among employees to interpret and use analytics effectively.
- Difficulty in integrating data from legacy systems and siloed databases for comprehensive analysis.
- Overcoming cultural barriers and organizational inertia to shift towards a data-driven decision-making approach.
In conclusion, mastering the art of business performance analytics can empower organizations to stay ahead of the curve, adapt to market dynamics, and achieve sustainable growth. By embracing data-driven strategies and continuous improvement, businesses can unlock their full potential and drive lasting success in a rapidly evolving business environment.
Maximizing business intelligence through data visualization is essential for modern businesses to stay competitive. BI dashboards offer a visually appealing way to interpret complex data sets, providing valuable insights for decision-making processes. By utilizing interactive charts and graphs, companies can easily track key performance indicators and identify trends that may impact their bottom line. Learn more about BI Dashboards Maximizing Business Intelligence through Data Visualization to harness the power of data visualization in your organization.
Implementing a strategic guide to business intelligence success is crucial for companies looking to leverage data effectively. BI implementation involves aligning technology with business goals, ensuring that data-driven decisions are made at all levels of the organization. With the right tools and processes in place, businesses can streamline operations and drive growth through actionable insights. Discover how to achieve BI success with BI Implementation A Strategic Guide to Business Intelligence Success and unlock the full potential of your data.
Revolutionizing data analytics for businesses, cloud-based BI solutions offer scalability and flexibility like never before. By harnessing the power of the cloud, companies can access real-time data insights from anywhere, at any time. Cloud-based BI solutions enable seamless collaboration and data sharing among team members, driving innovation and efficiency across the organization. Explore the benefits of Cloud-based BI solutions Revolutionizing Data Analytics for Businesses and stay ahead of the competition in today’s data-driven world.


