BI visualization tools play a crucial role in modern data analysis, providing businesses with valuable insights to drive informed decision-making. Dive into the world of BI visualization tools and discover how they revolutionize the way data is visualized and analyzed.
Introduction to BI Visualization Tools

BI visualization tools refer to software applications that transform raw data into visual representations such as charts, graphs, and dashboards. These tools play a crucial role in data analysis by providing users with a clear and intuitive way to interpret complex datasets. By visualizing data, BI tools help organizations gain valuable insights, identify trends, and make informed, data-driven decisions.
Purpose of BI Visualization Tools
BI visualization tools help in making data-driven decisions by presenting information in a visually appealing and easy-to-understand format. These tools enable users to explore data, uncover patterns, and identify relationships that may not be apparent in traditional data formats. By providing interactive dashboards and reports, BI visualization tools empower users to analyze data quickly and efficiently, leading to more informed decision-making processes.
Examples of Popular BI Visualization Tools
- Tableau: Tableau is a widely used BI visualization tool known for its user-friendly interface and powerful data visualization capabilities. It allows users to create interactive dashboards and reports to explore and analyze data.
- Power BI: Developed by Microsoft, Power BI is another popular BI visualization tool that offers robust data visualization features. It enables users to connect to various data sources, build interactive reports, and share insights across organizations.
- Qlik Sense: Qlik Sense is a self-service BI tool that allows users to create personalized data visualizations and dashboards. It leverages associative data modeling to help users explore data relationships and make data-driven decisions.
Features and Functionality of BI Visualization Tools

BI visualization tools offer a range of features that enable users to analyze and visualize data in a more intuitive and interactive manner. These tools play a crucial role in helping businesses make informed decisions based on data-driven insights.
Common Features Found in BI Visualization Tools
- Drag-and-drop interface for easy data visualization
- Customizable dashboards and reports
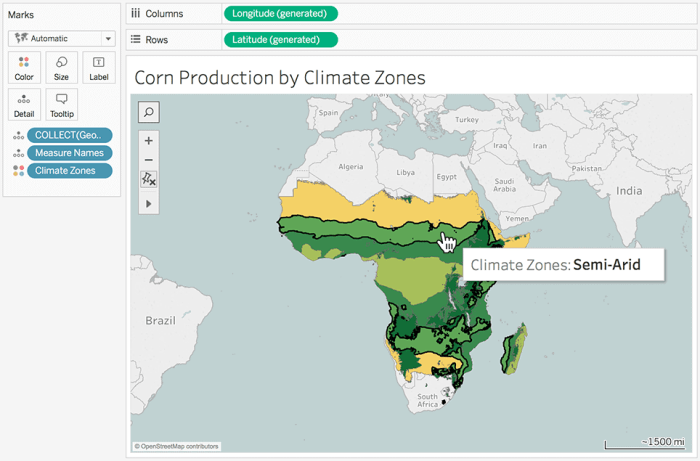
- Interactive charts, graphs, and maps
- Data filtering and drill-down capabilities
- Real-time data updates and alerts
How Interactivity Enhances the Usability of BI Visualization Tools
Interactivity is a key aspect of BI visualization tools as it allows users to explore data dynamically and gain deeper insights. By interacting with charts and graphs, users can uncover hidden patterns, trends, and outliers that may not be apparent in static reports. This hands-on approach fosters a better understanding of the data and enables users to make faster and more informed decisions.
Comparison of Functionality in Different BI Visualization Tools
| BI Tool | Data Connectivity | Visualization Options |
|---|---|---|
| Tableau | Wide range of data connectors | Diverse visualization types |
| Power BI | Seamless integration with Microsoft products | Rich set of visualization options |
| QlikView | In-memory data processing for faster analysis | Interactive and responsive visualizations |
Types of BI Visualization Tools
When it comes to BI visualization tools, they can be categorized based on their deployment and the types of visualizations they support. Let’s explore the different aspects of these tools.
Deployment Types, BI visualization tools
BI visualization tools can be classified based on their deployment method, which can vary from cloud-based to on-premise and hybrid solutions. Each deployment type has its own set of advantages and considerations.
- Cloud-based BI Tools: These tools are hosted on cloud servers and offer flexibility, scalability, and accessibility from anywhere with an internet connection. They are ideal for organizations looking for easy setup and maintenance.
- On-Premise BI Tools: On-premise tools are installed and operated on the organization’s own servers and hardware. They provide complete control over data security and customization but require more resources for maintenance.
- Hybrid BI Tools: Hybrid solutions combine elements of both cloud-based and on-premise tools. They allow organizations to leverage the benefits of both deployment methods while addressing specific requirements.
Types of Visualizations
BI visualization tools support a variety of visualizations to help users understand and analyze data effectively. Some common types include:
- Dashboards: Dashboards provide a visual overview of key metrics and KPIs, allowing users to monitor performance at a glance.
- Scorecards: Scorecards offer a more detailed view of performance against predefined targets and goals, helping organizations track progress and make informed decisions.
- Reports: Reports present detailed data analysis in a structured format, enabling users to delve deeper into specific insights and trends.
Importance of Mobile Responsiveness
With the increasing use of mobile devices, it is crucial for BI visualization tools to be mobile-responsive. Mobile responsiveness ensures that users can access and interact with data visualizations on smartphones and tablets, enabling on-the-go decision-making and collaboration.
Data Integration and Compatibility

When it comes to data integration and compatibility, BI visualization tools play a crucial role in connecting with various data sources and file formats to streamline the visualization process.
Data Source Integration
- BI visualization tools can integrate with different data sources such as databases, spreadsheets, and APIs.
- They provide connectors or plugins to establish a seamless connection with these sources.
- This integration allows users to pull in data from multiple platforms for analysis and visualization.
Compatibility with File Formats
- BI visualization tools are compatible with various file formats like CSV, Excel, JSON, and more.
- Users can import data in different formats directly into the tool for visualization purposes.
- This compatibility ensures flexibility in handling data from different sources without the need for extensive conversion.
Data Preparation and Cleaning Processes
- BI visualization tools offer features for data preparation and cleaning to ensure accuracy in visualization.
- Users can perform tasks like data transformation, filtering, and data quality checks within the tool.
- These processes help in refining the data before visualization, leading to more insightful and reliable outcomes.
In conclusion, BI visualization tools are indispensable for businesses looking to harness the power of data. With their advanced features and functionalities, these tools pave the way for efficient data analysis and strategic decision-making.
When it comes to evaluating the success of your business intelligence strategies, using BI performance metrics is crucial. These metrics provide valuable insights into the effectiveness of your BI initiatives and help in making informed decisions to drive growth and efficiency.
With the increasing trend towards mobile work environments, implementing Mobile BI tools can enhance accessibility and efficiency in data analysis. These tools allow users to access critical business insights on-the-go, empowering them to make quick and informed decisions.
Embracing Cloud-based BI solutions can revolutionize the way organizations handle data. By leveraging the scalability and flexibility of cloud technology, businesses can streamline their BI processes, reduce costs, and improve overall data management efficiency.


