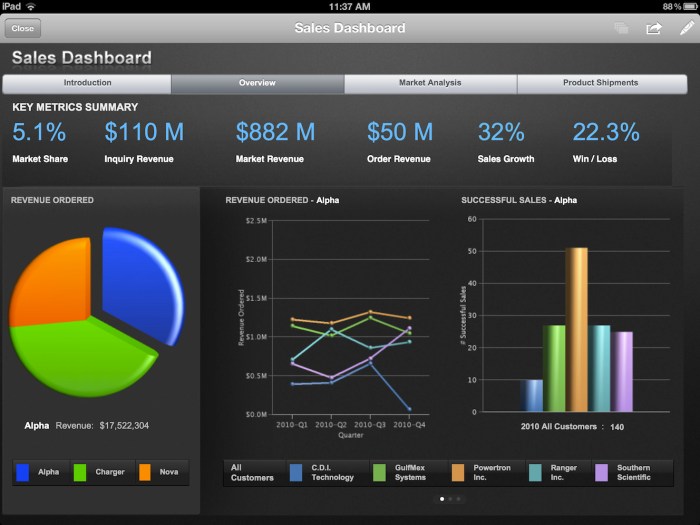
BI dashboards, the cornerstone of data analysis, offer a powerful tool for businesses to make informed decisions and drive growth. Dive into the realm of BI dashboards with this comprehensive guide that delves into their inner workings and benefits.
Overview of BI Dashboards
BI dashboards, or Business Intelligence dashboards, are data visualization tools that allow businesses to monitor, analyze, and track key performance indicators (KPIs) and metrics in real-time. The primary purpose of BI dashboards is to provide a clear and concise overview of an organization’s performance, enabling data-driven decision-making.
Industries Using BI Dashboards
- Finance: Banks and financial institutions use BI dashboards to track investments, detect fraud, and analyze market trends.
- Retail: Retailers utilize BI dashboards to monitor sales performance, inventory levels, and customer buying patterns.
- Healthcare: Hospitals and healthcare providers leverage BI dashboards to analyze patient outcomes, optimize resource allocation, and improve operational efficiency.
Benefits of BI Dashboards
- Improved Decision-Making: BI dashboards provide real-time insights, enabling businesses to make informed decisions quickly.
- Enhanced Data Visualization: Visual representations of data make it easier to identify trends, patterns, and outliers in the data.
- Increased Efficiency: By automating data analysis and reporting, BI dashboards save time and resources that would otherwise be spent on manual processes.
Key Components of BI Dashboards

BI dashboards are powerful tools that provide users with a visual representation of complex data to facilitate data-driven decision-making. The key components of BI dashboards include data visualization, KPIs, filters, data integration, and interactive features.
Data Visualization
Data visualization is a crucial element of BI dashboards as it allows users to interpret and analyze data quickly and effectively. Visual representations such as charts, graphs, and heat maps help users identify trends, patterns, and outliers in the data.
KPIs
Key Performance Indicators (KPIs) are metrics that measure the performance of an organization or specific processes. BI dashboards display KPIs in a visually appealing way, such as through gauges or scorecards, allowing users to track progress towards goals and objectives.
Filters
Filters enable users to customize the data displayed on the dashboard based on their specific requirements. Users can apply filters to focus on specific time periods, regions, or product categories, providing a more personalized and relevant view of the data.
Data Integration
Data integration is essential for creating comprehensive BI dashboards that consolidate data from multiple sources. By integrating data from various systems and databases, BI dashboards provide a unified view of the organization’s data, ensuring accuracy and consistency.
Interactive Features
Interactive features such as drill-downs, hover-over tooltips, and clickable elements enhance the user experience in BI dashboards. These features allow users to explore data in more detail, uncover insights, and make informed decisions based on their analysis.
Design Best Practices for BI Dashboards

When it comes to designing effective BI dashboards, there are several key principles to keep in mind to ensure that the dashboard is visually appealing, user-friendly, and provides valuable insights to users.
Importance of Choosing the Right Color Schemes and Layouts
Choosing the right color schemes and layouts for your BI dashboard is crucial for enhancing visual representation and user experience. Here are some key considerations to keep in mind:
- Use a consistent color palette: Stick to a cohesive color scheme throughout the dashboard to maintain visual harmony and make it easier for users to interpret data.
- Avoid using too many colors: Overloading the dashboard with too many colors can be overwhelming and distracting. Limit the color palette to a few key hues to ensure clarity.
- Consider color psychology: Different colors can evoke different emotions and associations. Be mindful of the psychological impact of colors on users and choose hues that align with the message you want to convey.
- Opt for a clean and organized layout: A clutter-free layout with clear data visualization elements will help users navigate the dashboard more easily and focus on the information that matters most.
Tips to Optimize Dashboard Performance and Responsiveness
Ensuring that your BI dashboard performs optimally and responds quickly to user interactions is essential for providing a seamless user experience. Here are some tips to optimize dashboard performance:
- Minimize data load times: Reduce loading times by optimizing data queries, using efficient data storage solutions, and caching frequently accessed data.
- Implement responsive design: Make sure your dashboard is responsive and adapts to different screen sizes and devices to accommodate a diverse user base.
- Utilize interactive elements wisely: Incorporate interactive elements such as filters and drill-down options strategically to enhance user engagement without sacrificing performance.
- Regularly monitor and fine-tune performance: Keep track of dashboard performance metrics, identify bottlenecks, and make necessary adjustments to ensure optimal speed and responsiveness.
Data Visualization Techniques in BI Dashboards

Data visualization is a crucial aspect of Business Intelligence (BI) dashboards as it helps users comprehend complex data sets quickly and make informed decisions. By using various visualization methods such as charts, graphs, and maps, BI dashboards can effectively present data insights in a visually appealing manner.
Charts
Charts are one of the most commonly used data visualization techniques in BI dashboards. They are effective in representing trends, comparisons, and distributions in data. Some popular types of charts used in BI dashboards include bar charts, line charts, pie charts, and scatter plots. Each type of chart has its own strengths and is suitable for different types of data. For example, bar charts are great for comparing categorical data, while line charts are ideal for showing trends over time.
Graphs, BI dashboards
Graphs are another essential data visualization technique in BI dashboards. They are effective in illustrating relationships and connections between different data points. Common types of graphs used in BI dashboards include network graphs, tree diagrams, and Sankey diagrams. Graphs are particularly useful when analyzing complex data sets with multiple variables and dependencies.
Maps
Maps are valuable visualization tools in BI dashboards, especially when dealing with geographical data. They help users visualize spatial patterns, distribution, and relationships between data points. By using interactive maps, users can drill down into specific regions and gain a better understanding of the data. Heat maps, choropleth maps, and point maps are some of the common map visualizations used in BI dashboards.
Overall, the key to effectively presenting data insights through visualization in BI dashboards is to choose the right visualization technique that aligns with the type of data being analyzed. By selecting the most appropriate charts, graphs, or maps, users can easily interpret complex data sets, identify trends, and make data-driven decisions.
In conclusion, BI dashboards serve as indispensable assets in the data-driven world, empowering organizations to harness the full potential of their data for strategic decision-making. Explore the possibilities that BI dashboards offer and revolutionize the way you analyze and interpret data.
Interactive BI reports play a crucial role in enhancing data insights by providing interactivity that allows users to analyze and visualize data in real-time. By utilizing interactive features such as filters, drill-downs, and dynamic visualizations, businesses can gain deeper insights and make data-driven decisions more effectively. Learn more about how Interactive BI reports Enhancing Data Insights with Interactivity here.
Data insights are essential for uncovering the power of data and driving business success. Through advanced analytics and visualization techniques, companies can extract valuable insights from their data to improve decision-making, optimize processes, and identify new opportunities. Discover more about how Data Insights Uncovering the Power of Data for Business Success here.
Big data analytics is a powerful tool for unleashing the full potential of data insights. By processing and analyzing large volumes of data, organizations can uncover hidden patterns, trends, and correlations that can drive innovation and competitive advantage. Explore how Big data analytics Unleashing the Power of Data Insights here.


